Creating SEO Reports for Customers That Prove Your Value

A good SEO report for customers is more than just a data export. It’s a strategic document. It has to translate all those complex metrics we track into a clear, compelling story about their business growth.
The best reports don't just show the numbers; they explain why those numbers matter and lay out a clear plan for what comes next. That's how you prove the real, tangible value of your SEO work.
Moving Beyond Basic Data Dumps
Let's be honest for a moment. Most client SEO reports are glorified spreadsheets. They're often skimmed, filed away, and promptly forgotten. This old way of doing things—just exporting data from a few tools and firing it off in an email—is completely broken.
Today’s clients expect more. They're paying for results, not raw data, so they need clarity, context, and a direct line drawn between our work and their bottom line.

Making this shift from data provider to strategic partner is everything when it comes to client retention. And with organic traffic projected to account for a massive 46.98% of all UK website visits in 2025, clear reporting has never been more critical.
A Real-World Example of Storytelling
I once inherited an account for a multi-location restaurant chain that was practically drowning in data. Their monthly "report" was a chaotic mess of keyword positions, impression numbers, and backlink counts. The stakeholders had absolutely no idea if our work was actually putting more diners in their seats.
Unsurprisingly, they were frustrated, and the account was on shaky ground.
We decided to tear up their reporting and start from scratch. Instead of leading with a wall of data, we started with a narrative.
- The Problem: We spotted that their Google Business Profiles were seriously under-optimised. This meant they were invisible in crucial "near me" searches, especially around lunchtime and dinner.
- Our Solution: We launched a targeted local SEO campaign. This involved optimising their GBP categories, actively responding to reviews, and posting high-quality photos of their food. We used many of the same strategies outlined in this guide on Google Business Profile management.
- The Result: Our new report showed them exactly how the dots connected. We visually demonstrated how our work on their local rankings directly led to a 30% increase in direction requests and a 25% jump in phone calls—which were mostly table bookings—across their most important locations.
By turning their report from a data dump into a growth story, we didn't just show them numbers; we showed them progress. We translated our technical work into tangible business outcomes: more customers and more revenue.
Why the Old Way Fails
The traditional method of just sending over raw data fails because it puts all the work on the client. They don't have the time, and often not the expertise, to figure out what a 15% increase in impressions actually means for their business. This communication gap breeds doubt and makes it incredibly difficult to prove your value.
This table really highlights the difference between the old way and a value-driven approach.
Old Reporting vs. Value-Driven Reporting
| Reporting Element | The Old Way (Data Dump) | The New Way (Proving Value) |
|---|---|---|
| Rankings | "You now rank #3 for 'widget maker'." | "Your #3 ranking for 'widget maker' drove 150 qualified visitors to the site this month." |
| Traffic | "Organic traffic increased by 10%." | "The 10% traffic increase led to 12 new demo requests, a key business goal." |
| Technical SEO | "We fixed 50 broken links." | "Fixing those broken links improved user experience, lowering your bounce rate by 5%." |
| Backlinks | "We acquired 5 new backlinks." | "These new backlinks from industry authorities have boosted your domain rating by 3 points." |
| Overall Focus | What did we do? | What results did we get? |
Ultimately, the goal is to answer the client’s silent question: "So what?"
Modern reporting isn’t about showing off everything you did; it’s about highlighting the specific actions that moved the needle for their business. To get a feel for how to structure these, it's worth checking out some SEO audit report sample generators for inspiration. Getting this right is how you secure those long-term, high-value partnerships.
Building Your Core Reporting Framework
Every truly great SEO report starts with a solid blueprint. Before you even touch a single piece of data, you need a framework that organises your insights in a way that makes sense to the client. It’s all about guiding them from the big-picture results down to the important details. Without that structure, you're just handing over a data dump, and even the best numbers can feel confusing or, worse, irrelevant.
Think of it like designing the user experience of your report. Your client is the user, and their goal is to quickly grasp how things are going without getting bogged down in jargon. A logical flow is your best friend here, creating a report that actually gets read, understood, and appreciated. To get beyond just throwing numbers on a page, a clear framework is non-negotiable; you can find some great general advice on mastering report formats that really drive home the importance of structure.
The aim is to create a predictable, easy-to-follow rhythm that clients get used to. This consistency builds trust and makes every report that follows that much easier for them to digest.
Start with a Punchy Executive Summary
Let's be honest, your client is busy. The Executive Summary is hands-down the most important part of your SEO report for customers. For some stakeholders, it might be the only section they read from top to bottom. This isn't just a fluffy intro; it's a tight, high-level overview of everything that happened.
Your summary should nail three key questions in just a few bullet points or a short, sharp paragraph:
- What were the biggest wins this month? For instance, "We hit page one for two of our high-value service keywords."
- How did this help the business? Something like, "This directly contributed to a 25% increase in qualified leads from organic search."
- What’s the plan for next month? For example, "Next up, we’re focusing on converting this new traffic by optimising key landing pages."
This section immediately sets the tone. It frames all the data that follows with real-world context and proves you're thinking about their business, not just your metrics.
The At-a-Glance KPI Snapshot
Right after the summary, give them a visual snapshot of the most critical Key Performance Indicators (KPIs). This usually works best as a simple table or a few "scorecard" style widgets. It provides a quick, scannable overview of progress before you get into the nitty-gritty.
This snapshot should only feature a handful of core metrics that tie directly back to what the client actually cares about. For a local plumber, that might be:
- Organic Sessions: How many people visited the site from Google.
- Google Business Profile Calls: The number of direct phone calls your work generated.
- Local Keyword Rankings: Their average position for crucial local searches like "emergency plumber near me".
- Goal Completions: The number of contact forms or quote requests submitted.
Pro Tip: Always, always show the previous period's data (last month or the same month last year) next to the current numbers. This simple comparison provides instant context, showing momentum and the trajectory of your efforts.
Breaking Down the Wins and What They Really Mean
With the high-level overview done, the rest of the report is where you explain the "how" and "why" behind the results. You'll want to structure this with clear subheadings that match the different parts of your SEO strategy. This makes the information much easier to digest and lets clients jump to the sections they care about most.
Technical and On-Page Health
Give a brief update on the foundational work. But don't just list tasks—explain the benefit. Instead of saying, "Fixed 15 broken links," try, "We tidied up 15 broken links to improve the experience for visitors and help search engines crawl the site more effectively."
Local SEO Traction
For any business chasing local customers, this section is a must. Visuals are your friend here—use things like geo-grid rank tracking maps to show them exactly where their visibility has improved. Be sure to highlight growth in metrics like direction requests and website clicks that come straight from their Google Business Profile.
Backlink and Authority Growth
Did you land some great new backlinks? Showcase them! But crucially, explain why it matters. Frame it in terms of building the website's authority and credibility in the eyes of Google, which is what will help it rank for more competitive terms down the line. Every section should tie your actions back to their goals, constantly reinforcing the value you're delivering.
Matching Metrics to Real Business Goals
Let’s be honest, a generic, one-size-fits-all SEO report is a one-way ticket to a client cancelling their contract. The metrics that get an e-commerce brand excited will be completely meaningless to a local plumber. To prove your worth, you have to look past vanity metrics and choose Key Performance Indicators (KPIs) that directly answer the client's real question: "How is your work making my business money?"
For a local service business—think plumbers, electricians, or locksmiths—the phone ringing is everything. Their success isn't measured in broad organic traffic stats but in actual, tangible local leads. Your report needs to reflect that reality.
So, instead of leading with overall website sessions, you should be putting the metrics that lead directly to new business front and centre.
- Google Business Profile (GBP) Phone Calls: This is the clearest, most direct measure of lead generation you can show from local search.
- GBP Direction Requests: This KPI proves you’re not just getting clicks, you're driving real people to their door.
- Geo-Grid Ranking Improvements: A visual map showing their rankings for "emergency plumber near me" have shot up in key postcodes is far more powerful than a simple list of keywords.
This initial decision—whether to deliver a high-level summary for a busy owner or a deep data dive for an engaged marketing manager—is a critical first step. The right choice sets the stage for a productive conversation.
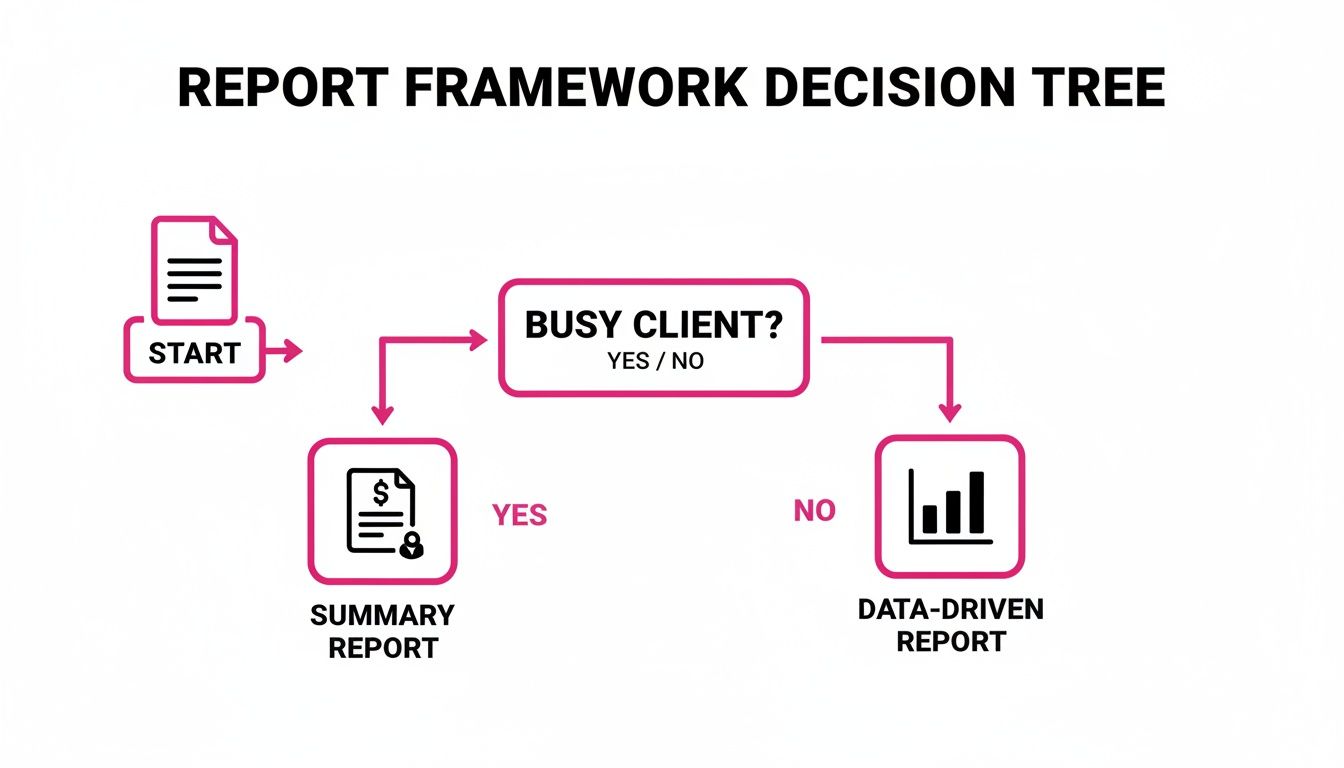
As you can see, tailoring your report’s depth to the client's schedule and interest is fundamental. A snappy summary ensures a time-poor client gets the key takeaways, while a detailed report gives a hands-on manager the data they crave.
Customising for E-commerce and Retail
An e-commerce store plays by a completely different rulebook. Who cares about local visibility when organic revenue is the name of the game? For these clients, the SEO report must draw a straight line from your keyword strategy to their sales figures.
Here, your focus shifts entirely to metrics that trace the customer’s path from a search query to a completed purchase.
- Organic Revenue: This is the bottom line. It’s the ultimate measure of success, pulled straight from Google Analytics with e-commerce tracking switched on.
- Rankings for High-Intent Keywords: You need to be tracking positions for terms like "buy [product name]" or "[brand] sale." These show a user is ready to pull out their credit card.
- Organic Conversion Rate: This KPI shows just how effective your search traffic is at turning into paying customers.
By customising your report this way, you stop being someone who just "does SEO." You become a key driver of their online sales engine, which is an infinitely more valuable position to be in.
Tailoring Reports for Multi-Location Businesses
Franchises and businesses with multiple locations are a unique puzzle. They need a bird's-eye view of the entire brand's performance and a granular look at how each individual location is doing. Your report has to serve two masters: the corporate marketing team and the local franchise owner.
A great multi-location report usually has a few key components:
- An Executive Overview: A top-level summary of brand-wide organic growth, visibility trends, and the total number of leads generated across all locations.
- Location-Specific Breakdowns: Separate pages or dashboards for each location, zeroing in on their individual GBP calls, local rankings, and review growth.
- Competitor Benchmarking: Showing how the Bristol branch stacks up against its local competitors can be a huge motivator and a clear sign of your impact.
For these businesses, visually tracking keyword positions across different postcodes is an absolute must. Getting a handle on effective strategies for rank tracking for local keywords is vital, as this granular data can shine a light on specific opportunities for each branch. This level of detail proves you understand the complexities of their business model.
To make this crystal clear, here’s a breakdown of how you might select KPIs based on the business you’re working with.
KPI Selection Based on Business Model
Choosing the right KPIs is about speaking your client's language. This table offers a simple guide for picking the metrics that will resonate most, ensuring your reports are always laser-focused on what truly matters to their bottom line.
| Business Type | Primary KPIs | Secondary KPIs | Metrics to De-emphasise |
|---|---|---|---|
| Local Service | GBP Calls, Direction Requests, Local Organic Traffic, Lead Form Submissions | Geo-Grid Rank Improvements, Review Count & Rating, GMB Impressions | Broad Keyword Rankings, Overall Site Traffic, Backlinks |
| E-commerce | Organic Revenue, Organic Conversion Rate, Transactions | Rankings for "Money" Keywords, Average Order Value, Shopping Feed Clicks | Phone Calls, Local Visibility Metrics, Overall Site Impressions |
| Multi-Location | Aggregate GBP Calls & Leads, Brand-level Organic Traffic, Location Page Traffic | Individual Location Rankings, Cross-Location Benchmarks | Individual Keyword Rankings (Non-geo), Bounce Rate (on its own) |
| SaaS/B2B | Demo Requests, Trial Sign-ups, Organic MQLs | Rankings for "Problem-aware" Keywords, Organic Traffic to Key Content | E-commerce Metrics, Local Search Metrics, Session Duration (in isolation) |
By focusing on these distinct sets of metrics, your reports will always be relevant and impactful.
Ultimately, the goal is to make the data resonate. A local service provider wants to see the phone ringing more. A retailer wants to see more sales notifications. A franchise wants to see growth across its entire network. By carefully selecting KPIs that align with these goals, your SEO reports transform from a simple list of tasks into a powerful testament to your strategic value. Your report becomes an indispensable business intelligence tool they can't imagine living without.
Turning Data into a Compelling Narrative
Having the right data is only half the battle. The real magic in creating an exceptional SEO report for customers happens when you move from being a data presenter to a storyteller. This is where you connect the dots for your client, turning abstract metrics into a clear, compelling story about their business growth.
Anyone can dump numbers into a report. A strong narrative, however, is what sticks. Instead of just listing what happened, your commentary needs to explain why it matters to their business and—crucially—what strategic moves you’re planning next. This simple shift transforms your report from a backward-glancing summary into a forward-looking roadmap.
From Observation to Insight
The heart of a great report narrative is context. A client might see "organic traffic increased by 15%" and think, "Great, I guess?" but they won't grasp its true value. Your job is to provide the "so what?" that gives that number meaning.
It’s all about ditching vague statements and embracing specific, powerful commentary.
- Weak Observation: "Organic traffic increased by 15%."
- Powerful Insight: "Our new blog content targeting 'emergency plumbing services' drove a 15% increase in organic traffic. This resulted in a 20% lift in tracked after-hours calls and an estimated £5,000 in new revenue."
See the difference? The second example doesn't just present a number; it links a specific action (our new content) to a direct business outcome (more money). This is how you prove the value of your day-to-day SEO work.
A Framework for Actionable Commentary
To make sure your insights always hit the mark, try structuring your commentary around this simple, three-part framework for every key metric you present.
- What Happened? State the result, clearly and concisely. Be specific with the data.
- Why Does It Matter? Explain the business impact. How does this connect to their goals, like leads, sales, or brand visibility?
- What's Next? Outline your recommended next steps based on this insight. Show them you’re already thinking ahead.
A powerful insight tells a complete story. It moves from a past result to a present impact and a future action, reassuring the client that you are in control and always optimising for their success.
Crafting Your Narrative with Sentence Starters
Staring at a blank page is sometimes the hardest part. Keeping a few go-to sentence starters in your back pocket can help you frame your insights and avoid just stating the obvious.
Here are a few I often rely on:
- "The significant growth in [Metric] this month was a direct result of our focus on [Your Action]…"
- "We noticed a trend where [Observation], which presents an opportunity to [Proposed Action]…"
- "While [Metric] saw a slight dip, this was an expected outcome of [Reason]. Our plan to address this is to [Your Strategy]…"
- "The increase in rankings for [Keyword Group] has directly contributed to a measurable lift in [Business Goal], proving the value of our content strategy."
These prompts force you to think beyond the numbers and provide the strategic analysis that clients actually pay for.
Using AI to Enhance Your Storytelling
Manually analysing trends and crafting these narratives can be time-consuming, but you don't have to do it all by hand. Modern tools can help speed things up. For instance, you can explore how to use AI for Local SEO to spot performance patterns or even generate first drafts of your commentary.
An AI assistant can quickly highlight correlations—like a spike in traffic from a specific blog post leading to more form fills—that you can then refine into a compelling story for your client. The trick is to use it as an assistant, not a replacement. Let it find the initial data connections so you can focus on the strategic interpretation and human touch that builds real trust.
Real-World Scenario: A Narrative in Action
Let’s say you’re reporting for a local dental practice. Here’s how you could apply this narrative framework to their Google Business Profile data.
The Data:
- GBP Impressions: +30%
- Direction Requests: +25%
- Phone Calls: +40%
The Narrative:
"This month, we saw fantastic growth in your local visibility, with a 30% increase in impressions on your Google Business Profile.
This matters because our work optimising your 'emergency dentist' service categories directly led to a 25% jump in direction requests and, more importantly, a 40% increase in phone calls. These aren't just vanity metrics; they represent potential new patients who need your services urgently.
Our next move is to build on this momentum. We'll be creating targeted Google Posts promoting your cosmetic dentistry services, aiming to capture a different segment of high-value local searchers next month."
This approach turns a boring data update into a clear demonstration of ROI, reinforces the value of your specific actions, and sets clear expectations for what’s next. It’s this level of communication that separates a good agency from a truly great one.
How to Automate and Scale Your Reporting
Let's be honest, manually building detailed SEO reports every month is a soul-crushing time sink. It’s exactly the kind of repetitive work that quietly drains your agency's profitability, pulling your best people away from high-value strategy and into the drudgery of copy-and-paste. This isn’t just slow; it’s a process riddled with potential for human error, creating inconsistencies that can slowly chip away at client trust.
The real goal here is to get your team out of the data entry business and into the data interpretation business. Your clients are paying you for your strategic mind, not your ability to populate a spreadsheet. By getting smart with automation, you can claw back dozens of hours each month, guarantee every report is spot-on accurate, and free up your strategists to do the work that actually gets results.
Choosing the Right Automation Tools
The secret to efficient reporting is finding a tool that can plug into all your different data sources and pull everything together into one clean, cohesive dashboard. You need a platform that can speak fluently with the pillars of your SEO data.
At a minimum, look for tools that connect directly with:
- Google Analytics 4 (GA4): For all your foundational traffic, engagement, and conversion metrics.
- Google Business Profile (GBP): Absolutely essential for tracking local SEO performance—think calls, direction requests, and visibility in local searches.
- Google Search Console (GSC): To pull in that crucial data on impressions, clicks, and keyword rankings.
Modern platforms, like our own comprehensive analytics and reporting suite, are built for this exact purpose. They use APIs to connect to these sources, automatically refreshing the data so your reports are always current without anyone having to lift a finger. This move toward automation is a huge reason for growth in the industry.
Just look at the UK market. The SEO software space kicked off 2025 with a valuation of USD 7.50 billion, and that number is expected to explode. Projections show it rocketing towards USD 29.52 billion by 2033, fuelled by an impressive 18.5% compound annual growth rate. This is happening because more and more businesses are demanding better tools for local visibility. You can dig into the full analysis of these market trends on prsync.com.
The Power of White-Label Reporting
Automation isn’t just about saving time—it’s a massive branding opportunity. White-label reporting lets you strip away the software provider's branding and replace it with your own agency’s logo and colours. It seems like a small thing, but it has a huge impact on how clients perceive you.
When a client gets a report that looks and feels like it was custom-built by your agency, it instantly reinforces your professionalism. It creates a polished, unified front that makes you look more established and resourceful. It subtly tells them you have your own systems, even if you’re using a third-party platform behind the curtain.
A white-labelled report transforms a software-generated document into a piece of your agency's intellectual property. It’s a crucial step in positioning yourself as a high-end strategic partner, not just another service reseller.
Building a Scalable Reporting Workflow
Once you've got the right tool in your corner, you can build a reporting workflow that works just as well for one client as it does for a hundred. The trick is to create a master report template. Think of this as your blueprint, containing all the core sections and KPIs most of your clients will care about, from the executive summary right down to the nitty-gritty local SEO breakdown.
With that master template in place, bringing on a new client becomes almost trivial:
- Duplicate the Template: Simply make a copy of your master report.
- Connect New Data Sources: Hook up the new client's GA4, GBP, and GSC accounts.
- Customise KPIs: Make a few small tweaks to focus on the metrics that are most important to that specific client’s business.
- Set Up Automated Delivery: Schedule the report to be emailed or sent as a shareable link on the first of the month, every month.
You’ve just turned what used to be a half-day job into a quick 15-minute setup. By systemising your reporting like this, you ensure every client gets a consistently professional and insightful report, on time, every time—with barely any ongoing effort. That kind of efficiency is how you scale an agency profitably.
Answering Those Tricky Client Questions
Let's be honest, creating client reports always comes with a few tough questions. If you’ve been doing this for a while, you can probably recite them in your sleep.
Having solid, confident answers ready is part of the job. It’s not just about defending your work; it’s about managing expectations and proving you’re the expert they hired. Getting these conversations right is what turns a good client relationship into a great one.
Think of this as your playbook for those inevitable curveballs. We'll cover everything from explaining why rankings sometimes dip to proving the value of all that "invisible" tech work you do.
“My Rankings Dropped! What Happened?”
First things first: don’t panic. And don't let your client panic. Dips and fluctuations are completely normal in the world of SEO. The trick is to get ahead of the conversation.
As soon as you spot a downturn, dig in and find out why. Was there a big Google algorithm update? Did a competitor just throw a bunch of money at a new campaign? Or is it simply a seasonal trend for their industry?
Your report needs to tackle this head-on. Explain what you think caused the dip and, more importantly, lay out your plan to get things moving in the right direction again. Honesty is your greatest asset here—it builds a huge amount of trust, even when the news isn't great.
“Why Isn’t This SEO Thing Working Faster?”
Ah, the classic. This is probably the most common question in the history of SEO. Even if you set crystal-clear expectations in your kick-off call, clients often need a gentle reminder. SEO isn't a tap you can just turn on for instant traffic. It's an investment.
I find analogies work wonders here.
"Think of your website like a new shop opening on the high street. You wouldn't expect a queue out the door on day one. We're building your reputation from the ground up, earning trust with both customers and Google, and that process takes time to do properly."
While you wait for the big-ticket KPIs to move, point to the smaller wins that show you're on the right track. These are your leading indicators of success.
- Are keyword impressions climbing? That means more people are seeing their brand in search results.
- Have you seen movement on some of the less competitive, long-tail keywords?
- Are metrics like Domain Authority showing slow and steady growth?
These small victories prove the strategy is working, even before the phone starts ringing off the hook.
“What Am I Paying for With All This ‘Technical SEO’ Stuff?”
To a client, technical SEO can feel a bit like magic—or worse, a complete abstraction. They can’t see a faster page load time like they can see a new blog post. It’s your job to connect those invisible fixes to real-world business results.
Don’t just tell them what you did; tell them why it matters.
Frame your work in terms of their customers and their revenue. For instance, instead of saying, "We improved your site speed," try this: "We shaved two seconds off your site's loading time. Industry data shows that can cut the number of people who give up and leave by half, which means more potential customers actually see your products and make a purchase."
Always bring it back to their bottom line. When you connect technical tweaks to a better customer experience and more sales, the value becomes instantly clear.
By framing your answers around strategy, transparency, and the client’s actual business goals, you can transform a tricky question into an opportunity to shine.
Ready to build reports that answer questions before they’re even asked? LocalHQ provides a complete analytics suite that turns complex data into clear, actionable insights. With our white-label reporting, you can deliver professional, automated SEO reports for customers that prove your value every time. Learn more about LocalHQ’s reporting tools.